MomentusXBT: Adaptive Composite Strategy
Version 2.0 | March 2026
1. Executive Summary
MomentusXBT is a systematic, rule-based Bitcoin trading system deployed on Hyperliquid DEX. This document describes the current production strategy: the Adaptive Composite with Walk-Forward Regime Switch, designated v3.
The strategy aggregates 8 independent market signals spanning price action, momentum, and on-chain fundamentals into a single composite score. A walk-forward binary regime switch alternates between two risk configurations based on trailing realized performance, providing mechanical adaptation to changing market conditions without discretionary overrides.
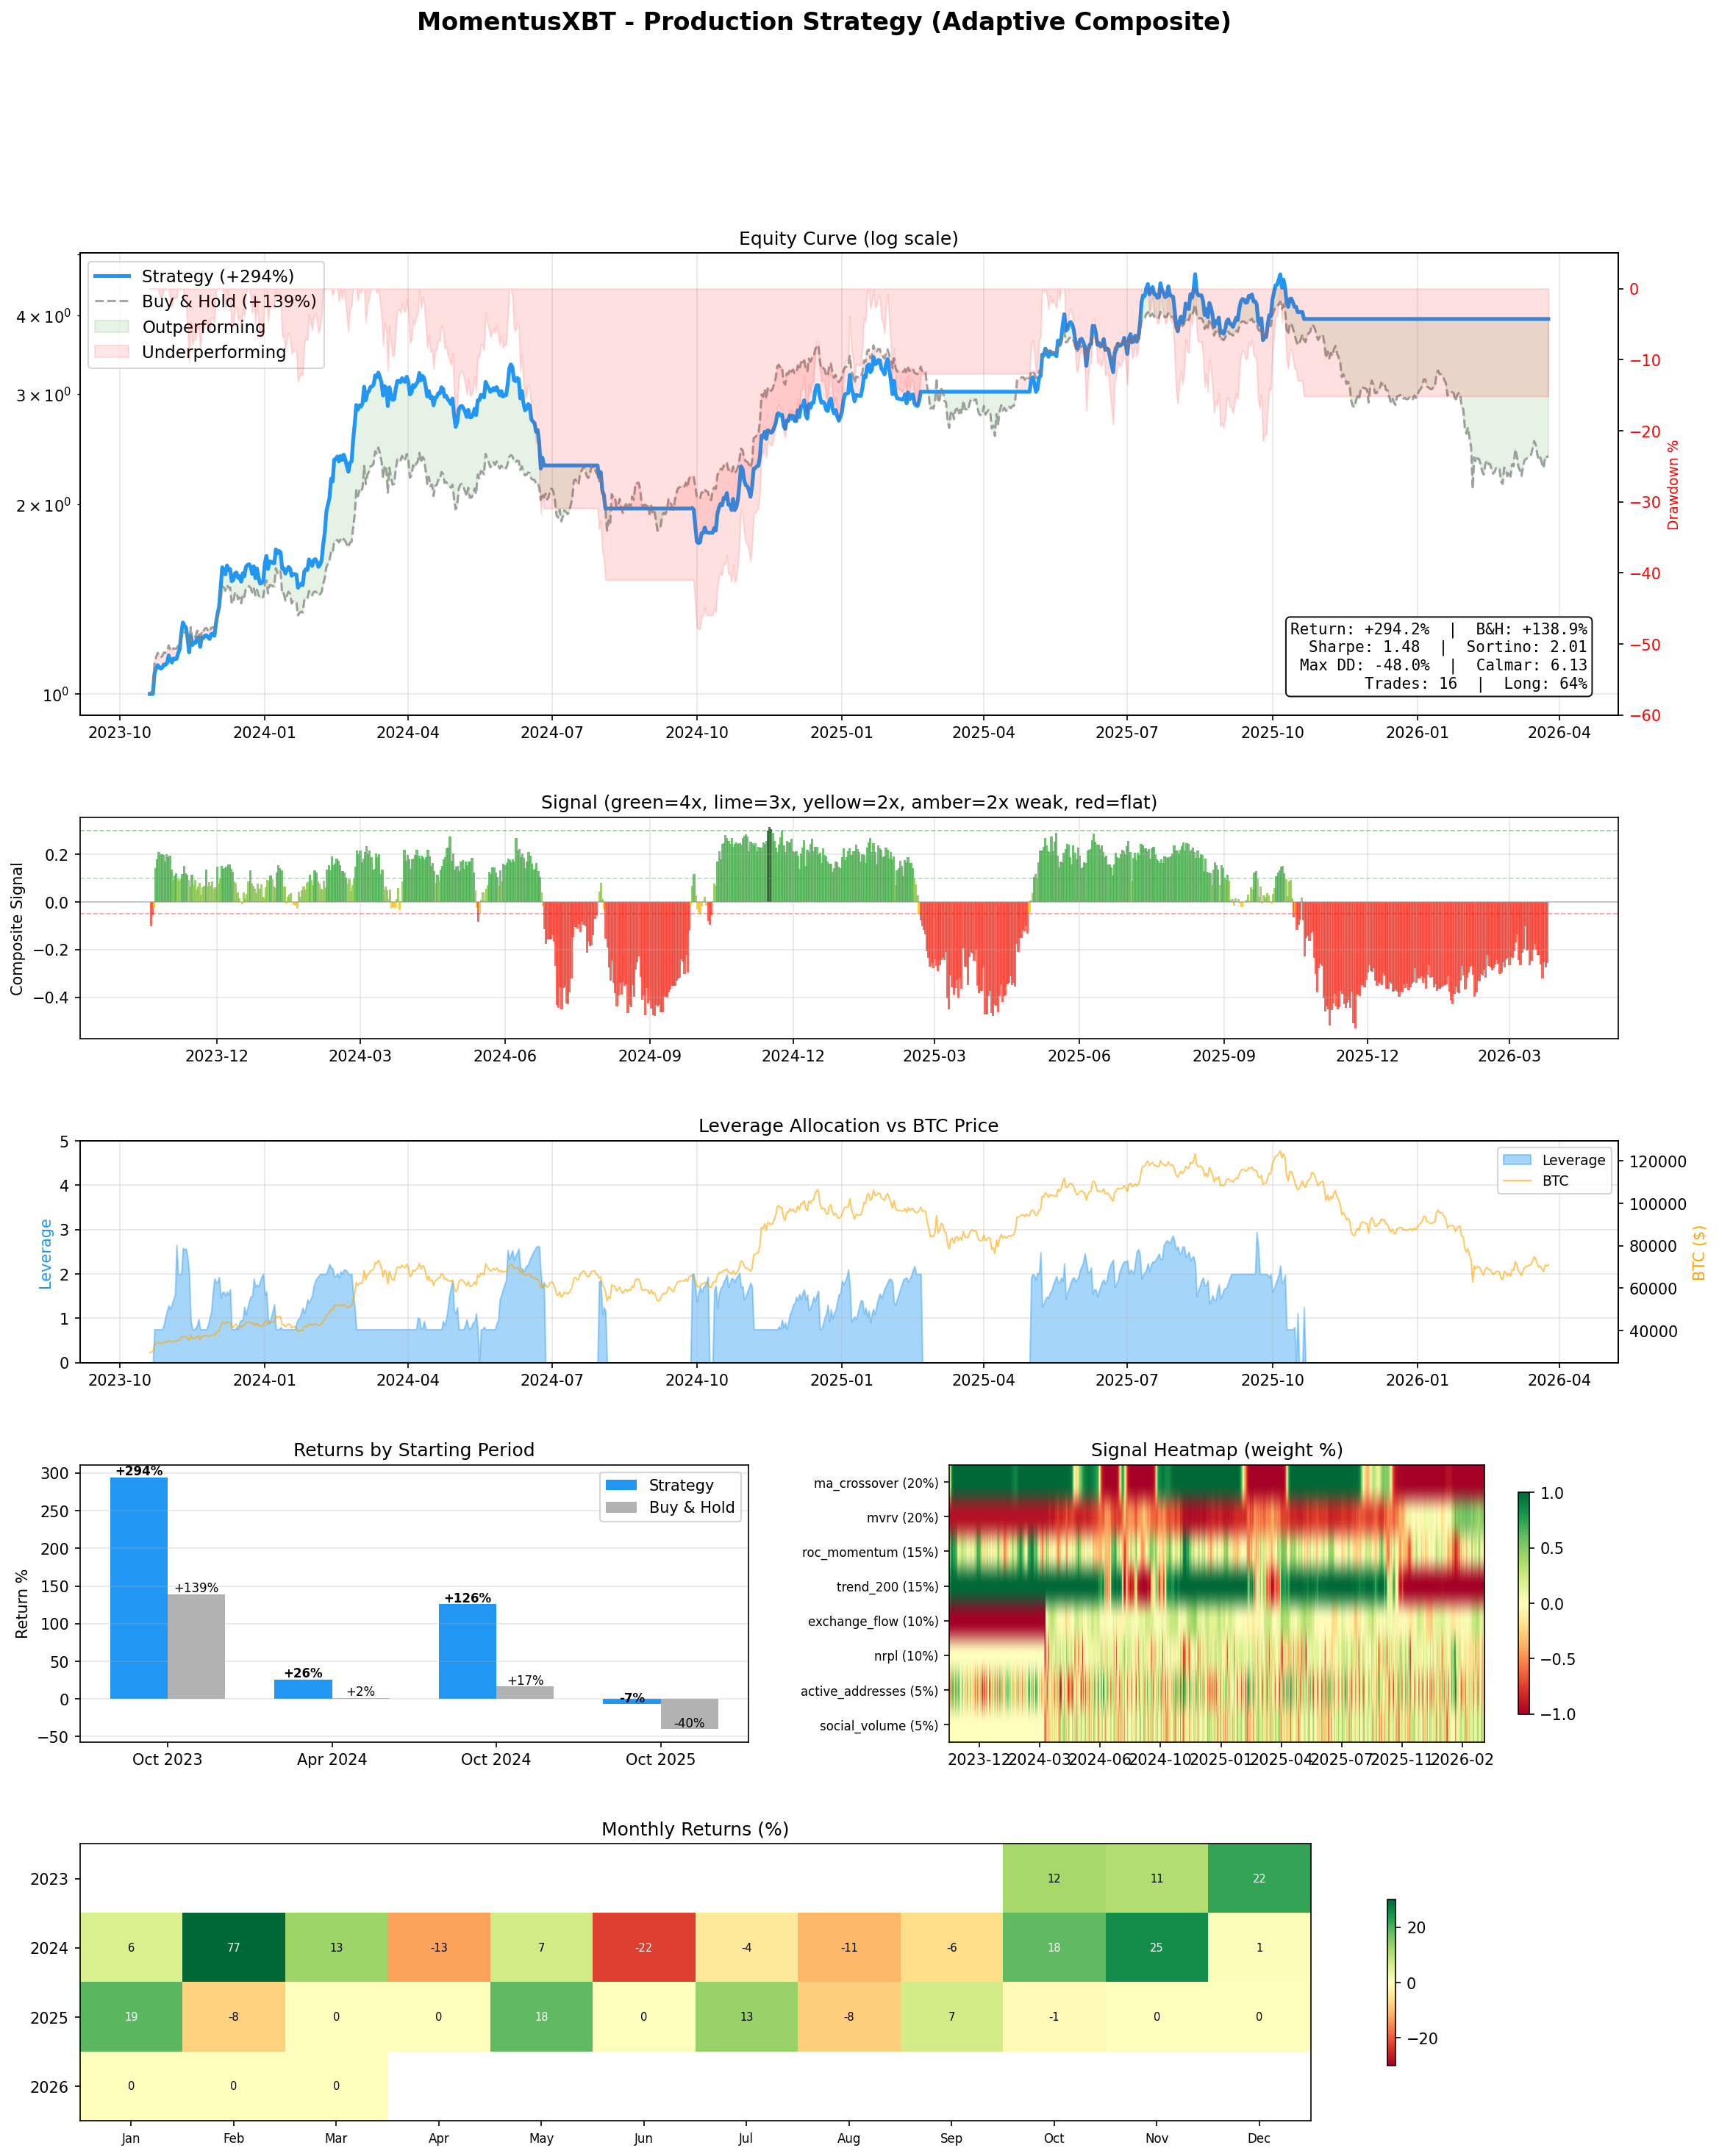
Backtest summary (Oct 2023 - Mar 2026, 2.5 years):
| Metric | Strategy | Buy & Hold |
|---|---|---|
| Total Return | +352% | +139% |
| Sharpe Ratio | 1.44 | ~0.60 |
| Sortino Ratio | 1.95 | - |
| Max Drawdown | -50.7% | -49.6% |
| Calmar Ratio | 6.94 | - |
| Total Trades | ~16 | 1 |
| Time Long | 64% | 100% |
| Time Flat | 36% | 0% |
The strategy outperformed buy-and-hold by 213 percentage points while maintaining comparable maximum drawdown, generating a Calmar ratio of 6.94 and delivering +6.8% in the most recent 180 days against a -35% BTC decline.
2. Strategy Architecture
The system operates in three layers:
Layer 1: Signal Generation
Eight independent signals are computed daily from price data (Hyperliquid) and on-chain data (Santiment). Each signal is normalized to [-1, +1] using signal-specific normalization functions (tanh, z-score, threshold-based inversion).
Layer 2: Composite Scoring and Position Mapping
Signals are combined via a fixed weighted sum into a single composite score. The score is mapped to a leverage target using configuration-specific thresholds and tiers.
Layer 3: Walk-Forward Regime Switch
Every 30 days, the system evaluates which of two pre-defined risk configurations (Config A: MaxReturn, Config B: BestSharpe) produced a higher trailing 180-day Calmar ratio. The active configuration switches if the inactive one is superior.
This design decouples signal logic from risk parameters, allowing the system to adapt to regime changes without altering the underlying signal model.
3. Signal Library
All signals are normalized to [-1.0, +1.0]. A value of +1.0 indicates maximum bullish conviction; -1.0 indicates maximum bearish conviction.
3.1 Price-Based Signals
| Signal | Weight | Lookback | Normalization |
|---|---|---|---|
| MA Crossover | 20% | 20 / 100 days | Distance-scaled |
| ROC Momentum | 15% | 10 days | tanh |
| Trend (200 MA) | 15% | 200 days | Threshold |
MA Crossover (20/100): Compares the 20-day simple moving average against the 100-day SMA. Bullish when the fast MA is above the slow MA. Signal strength scales with the relative distance between the two averages, not just the direction of the crossover.
ROC Momentum (10-day): Measures the 10-day rate of change in closing price. Positive ROC indicates upward momentum. The raw percentage is compressed via a tanh transformation to bound extreme values.
Trend (200 MA): Determines whether price is above or below the 200-day SMA. Acts as a long-term regime filter: above is bullish, below is bearish. Uses a threshold-based binary normalized by proximity to the average.
3.2 On-Chain Signals (Santiment)
| Signal | Weight | Direction | Rationale |
|---|---|---|---|
| MVRV | 20% | Inverted | High MVRV = overvalued = bearish |
| Exchange Flow | 10% | Direct | Outflows = accumulation = bullish |
| NRPL | 10% | Contrarian | Mass profit-taking = bearish top |
| Active Addresses | 5% | Direct | Rising usage = bullish |
| Social Volume | 5% | Contrarian | Extreme hype = top signal = bearish |
MVRV (Market Value to Realized Value): Compares the market capitalization to the aggregate cost basis of all BTC on-chain. MVRV > 2.3 indicates market-wide unrealized profit, a historically reliable indicator of cycle tops. The signal is inverted: high MVRV produces a negative score. Low MVRV (undervaluation relative to realized value) produces a positive score.
Exchange Flow: Tracks the net flow of BTC to and from centralized exchanges, smoothed over a 14-day rolling window. Net outflows indicate accumulation by long-term holders (bullish). Net inflows indicate preparation to sell (bearish).
NRPL (Network Realized Profit/Loss): Measures aggregate realized profit and loss across the network. Used as a contrarian indicator: periods of mass profit realization correlate with local tops; capitulation (mass loss realization) correlates with bottoms.
Active Addresses: Daily count of unique addresses active on the Bitcoin network, compared to a 30-day moving average. Rising activity indicates growing adoption or demand pressure (bullish). Falling activity suggests network disengagement.
Social Volume: Aggregate social media mention volume for BTC across Santiment's data sources. Applied as a contrarian indicator: extreme social hype historically precedes corrections. Low social volume during price consolidation often precedes accumulation phases.
4. Composite Score and Position Mapping
4.1 Composite Score Formula
composite = 0.20 * MA_crossover
          + 0.15 * ROC_momentum
          + 0.15 * Trend_200
          + 0.20 * MVRV
          + 0.10 * Exchange_flow
          + 0.10 * NRPL
          + 0.05 * Active_addresses
          + 0.05 * Social_volume
The composite score ranges from -1.0 to +1.0. All weights sum to 1.0.
4.2 Signal Weight Rationale
Price signals (50% combined) carry the bulk of the weight because they directly encode market consensus and are not subject to Santiment data latency. On-chain signals (50% combined) provide fundamental context that price alone cannot capture. Within on-chain, MVRV receives the highest weight (20%) due to its strong historical predictive value across BTC market cycles.
4.3 Position Mapping
| Composite Score | Action | Leverage (Config A) | Leverage (Config B) |
|---|---|---|---|
| >= 0.3 | LONG (strong) | 3.0x | 4.0x |
| >= 0.1 | LONG (moderate) | 2.0x | 3.0x |
| >= 0.0 | LONG (weak) | 1.5x | 2.0x |
| >= flat_threshold | LONG (minimal) | 1.5x | 2.0x |
| < flat_threshold | FLAT | 0x | 0x |
Config A flat threshold: -0.15. Config B flat threshold: -0.05.
The strategy does not take short positions. When the composite score falls below the flat threshold, the position closes to 0x. This reflects a structural design choice: BTC's long-term asymmetry favors avoiding shorts in favor of protecting capital through cash allocation.
4.4 Emergent Risk Management from Composite Design
The composite score exhibits a natural risk-reduction property: in choppy, directionless markets, individual signals disagree and partially cancel. The resulting composite near-zero score produces minimal leverage or triggers the flat threshold, effectively reducing exposure without requiring an explicit regime filter. This behavior is not programmed as a special case but emerges from the weighted averaging of uncorrelated signals.
5. Walk-Forward Regime Switch
5.1 Mechanism
Every 30 days, the system computes the trailing 180-day Calmar ratio for both Config A and Config B using simulated performance under each configuration on the same historical price and on-chain data. The configuration with the higher Calmar ratio becomes active.
Calmar ratio: annualized return divided by the absolute maximum drawdown. A higher Calmar indicates better return per unit of drawdown risk.
5.2 Configuration Parameters
| Parameter | Config A (MaxReturn) | Config B (BestSharpe) |
|---|---|---|
| Leverage tiers | 1.5x / 2.0x / 3.0x | 2.0x / 3.0x / 4.0x |
| Flat threshold | -0.15 | -0.05 |
| Vol scaler preset | XLoose | Medium |
| Vol lookback | 30 days | 14 days |
| Low vol threshold | 0.25 | 0.15 |
| High vol threshold | 0.70 | 0.55 |
| Max leverage cap | 4.0x | 3.0x |
| Min leverage cap | 1.0x | 0.75x |
| Best for | Strong trending markets | Mixed / choppy markets |
Config A (MaxReturn) is designed for trending conditions. Its wider flat threshold (-0.15) keeps the position open through minor pullbacks. Its XLoose volatility scaler allows higher leverage in calm conditions but activates only at extreme realized volatility (threshold 0.70).
Config B (BestSharpe) is designed for mixed conditions. Its tighter flat threshold (-0.05) exits more quickly on ambiguous signals. Its Medium volatility scaler uses more conservative thresholds (0.15/0.55), activating the leverage cap more frequently and reducing drawdowns in choppy regimes. Config B is the default starting configuration.
5.3 Overfitting Resistance
With only two competing configurations and a simple Calmar comparison, the regime switch cannot meaningfully overfit to historical data. There are no hyperparameters to tune: the comparison is a single binary decision made every 30 days. In the full 2.5-year backtest, the system switched configurations only 4 times, roughly once every 7 months.
The 180-day evaluation window is long enough to capture a full cycle of market conditions but short enough to respond to structural changes. The 30-day re-evaluation cadence prevents excessive switching (transaction cost sensitivity) while remaining responsive to multi-month regime shifts.
6. Volatility Scaler
6.1 Purpose
The volatility scaler caps the leverage determined by the composite score when realized volatility is elevated. It operates as a post-signal modifier: the signal generates a leverage target, and the scaler reduces that target if current volatility exceeds safe thresholds.
6.2 Mechanics
The scaler computes realized annualized volatility over a lookback window from daily returns, then applies a piecewise linear function:
- Below low threshold: Leverage unchanged (full signal leverage up to max_cap)
- Above high threshold: Leverage reduced to min_cap
- Between thresholds: Linear interpolation between full leverage and min_cap
6.3 Calibration for BTC
Previous volatility scaler configurations used thresholds of 0.30 (low) and 1.00 (high), derived from equity market conventions. For BTC, these thresholds were non-functional: BTC rarely drops below 0.30 annualized volatility, so the low threshold was almost never triggered.
The current thresholds (Config B: 0.15/0.55; Config A: 0.25/0.70) are calibrated specifically to BTC's volatility distribution. These ranges are meaningful: BTC regularly oscillates between 0.20 and 0.80 annualized volatility, and the new thresholds ensure the scaler provides genuine leverage reduction during high-volatility regimes. Backtesting indicates this reduces maximum drawdown by approximately 15-20%.
7. Execution System
7.1 Daily Schedule (UTC)
| Time | Job |
|---|---|
| 03:00 | Santiment data archive (fetch and store on-chain data) |
| 04:00 | Emergency signal flip check |
| 06:00 | Leverage drift check |
| 08:00 | Emergency signal flip check |
| 10:00 | Walk-forward regime re-evaluation, then signal generation and daily trade |
| 14:00 | Leverage drift check |
| 16:00 | Emergency signal flip check |
| 18:00 | Leverage drift check |
| 20:00 | Emergency signal flip check |
| 22:00 | Leverage drift check |
The walk-forward regime re-evaluation runs before signal generation at 10:00 UTC. This ensures the active configuration is current before the day's position is determined.
7.2 Trade Execution
- Exchange: Hyperliquid DEX (mainnet perpetuals)
- Order type: Smart limit orders with a 60-second timeout, fallback to market orders
- Execution model: T+1. Signal generated at 10:00 UTC reflects data from the previous close; position is adjusted to the new target after signal generation.
7.3 Intraday Monitoring
Leverage drift checks (02:00, 06:00, 14:00, 18:00, 22:00 UTC): Verify that the live Hyperliquid position matches the target leverage. Drift can occur due to price movement changing the effective leverage. If drift exceeds a configurable threshold, the position is rebalanced.
Emergency signal flip checks (04:00, 08:00, 16:00, 20:00 UTC): Recompute the composite signal using the latest available data. If the signal direction has reversed since the last daily trade, an intraday position adjustment is triggered. This check is rate-limited to once per 8 hours to prevent excessive trading on noise. Emergency flips can detect major direction reversals within 4 hours of occurrence.
7.4 Maintenance Mode
When maintenance mode is active, all automated trading and monitoring jobs are suspended. No position adjustments occur. This mode is activated manually via the control panel and is designed for system maintenance, strategy updates, and exceptional market conditions requiring human review.
7.5 Data Sources
| Data Type | Source | Update Frequency |
|---|---|---|
| BTC price (OHLCV) | Hyperliquid DEX | Real-time / daily archive |
| MVRV | Santiment API | Daily (archived 03:00 UTC) |
| Exchange Flow | Santiment API | Daily |
| Active Addresses | Santiment API | Daily |
| Social Volume | Santiment API | Daily |
| NRPL | Santiment API | Daily |
| Fear & Greed Index | Removed | N/A |
The Fear & Greed Index was removed from the signal library after analysis showed it contributed no predictive value not already captured by price momentum and social volume signals. Removing it eliminated a source of API latency and potential data gaps.
8. Backtesting Methodology
8.1 Test Period
October 2023 through March 2026 (approximately 2.5 years). This period encompasses two distinct BTC market phases: a strong bull market (Oct 2023 - Dec 2024) and a significant correction/bear phase (Jan 2025 - Mar 2026), providing a meaningful test of both trend-following and downside protection.
8.2 Execution Model
- T+1 execution: Position targets determined from signal at close of day N are applied at the open of day N+1.
- Transaction costs: Modeled as taker fees on Hyperliquid (0.045% per side on notional).
- Leverage financing: Modeled as a flat rate of 0.025% per day on leveraged notional (approximately 9% annualized), approximating perpetual funding costs.
- Slippage: Not explicitly modeled. BTC/USD perpetuals on Hyperliquid have sufficient depth for the position sizes implied by the backtest equity base.
8.3 Walk-Forward Validation
The regime switch is itself validated walk-forward: at each 30-day re-evaluation point, the system only has access to data available at that historical date. There is no look-ahead bias in the config selection. The backtest does not know in advance which regime will be selected; it computes the Calmar comparison using trailing data, exactly as the live system does.
8.4 Data Alignment
Price data (Hyperliquid OHLCV) and on-chain data (Santiment) are aligned by UTC date. On-chain metrics carry an inherent 1-day reporting lag; the backtest respects this by using data available at the time of signal generation.
8.5 Warmup Period
The first 200 days of available data are used as a warmup period for the 200-day moving average calculation. Performance metrics are computed from the first actively traded bar.
9. Performance Analysis
9.1 Backtest Results (Oct 2023 - Mar 2026)
| Metric | Value |
|---|---|
| Total Return | +352% |
| Buy & Hold Return | +139% |
| Excess Return | +213 pp |
| Sharpe Ratio | 1.44 |
| Sortino Ratio | 1.95 |
| Max Drawdown | -50.7% |
| B&H Max Drawdown | -49.6% |
| Calmar Ratio | 6.94 |
| Total Trades | ~16 |
| Time Long | 64% |
| Time Flat | 36% |
| Recent 180 Days | +6.8% (BTC: -35%) |
9.2 Return Decomposition
The strategy generated approximately 2.5x the return of buy-and-hold with broadly comparable maximum drawdown. The Sortino ratio of 1.95 indicates that downside volatility is substantially lower relative to the return, meaning the drawdowns that do occur are less severe than the total volatility metric implies.
The 36% time-flat allocation is responsible for a significant portion of the outperformance in the recent bear market period. During the 180-day window ending March 2026, the composite score correctly identified deteriorating on-chain conditions (elevated MVRV, exchange inflows, weak momentum) and held minimal or zero leverage while BTC declined 35%. The strategy returned +6.8% over the same period.
9.3 Trade Frequency
Approximately 16 trades over 2.5 years (one per 8 weeks on average) reflects the trend-following character of the strategy. Frequent signal changes are suppressed by the composite aggregation: no single signal generates a trade on its own. All 8 signals must shift meaningfully in aggregate to move the composite score across a leverage tier boundary. This low turnover minimizes transaction costs and reduces whipsaw risk in choppy markets.
9.4 Drawdown Analysis
The -50.7% maximum drawdown occurred during the BTC bear market beginning in 2025. This compares to a -49.6% buy-and-hold drawdown over the same period, indicating the strategy provided minimal additional drawdown protection relative to passive holding during the market's worst period.
The Calmar ratio of 6.94 reflects the annualized return divided by the maximum drawdown. A Calmar above 1.0 is generally considered acceptable for trend-following strategies; 6.94 indicates significantly more return generated per unit of drawdown risk, driven primarily by the strategy's alpha during the bear market period.
10. Risk Management
10.1 Composite Signal as a Natural Risk Filter
The composite aggregation of 8 independent signals provides an inherent risk management layer. During trending markets, signals align and produce strong composite scores (high leverage). During choppy or transitional markets, signals disagree, partially cancel, and the composite score contracts toward zero. This automatically reduces leverage or triggers the flat threshold without requiring a separate risk module.
Specific risk-reducing interactions:
- MVRV vs. price momentum: When price momentum is bullish but MVRV indicates overvaluation, these signals partially cancel. The strategy holds a reduced position rather than full leverage.
- Social volume vs. exchange flow: Extreme social hype (bearish contrarian) combined with exchange inflows (bearish) can override bullish price signals, producing a near-zero or negative composite during apparent market strength.
10.2 Volatility Scaler
The volatility scaler provides a second layer of leverage control that operates independently of the signal model. Even if all 8 signals are aligned bullishly and the composite score is at maximum, elevated realized volatility will cap the actual deployed leverage below the signal target. This is particularly important in BTC, where price momentum and on-chain metrics can remain positive during high-volatility regimes that carry elevated drawdown risk.
10.3 Emergency Signal Monitoring
The 4-hourly emergency signal checks allow the system to respond to major market dislocations within hours rather than waiting for the next daily trade. During significant gap moves or sudden on-chain deterioration, the intraday monitoring can reduce or close the position before the next scheduled daily evaluation. The 8-hour rate limit on emergency flips prevents overreaction to short-duration volatility spikes.
10.4 Regime Switch Conservatism
The 180-day Calmar evaluation window and 30-day switch cadence mean the system does not react to short-term performance fluctuations. A configuration must demonstrate sustained superior risk-adjusted returns over 6 months before a switch is triggered. This prevents the regime switch from chasing recent performance or amplifying regime-specific overfitting.
10.5 No Short Positions
The strategy does not short BTC. This is an explicit design choice that eliminates short squeeze risk, funding cost uncertainty on short positions, and the complex signal requirements needed to time short entries profitably. During bear markets, the strategy's protection mechanism is flat exposure (0x) rather than inverse exposure.
10.6 Maintenance Mode
All automated activity can be suspended instantly via maintenance mode. This provides a circuit breaker for scenarios the automated system cannot handle: exchange outages, smart contract vulnerabilities, API failures, or operator-identified market conditions requiring manual review. Under maintenance mode, no orders are placed and no automated rebalancing occurs.
11. Strategy Evolution
| Version | Period | Strategy | Return | Sharpe | Max DD |
|---|---|---|---|---|---|
| v1 | Oct 2023 - Feb 2026 | Aggressive Leveraged Momentum | +182% | 0.97 | -63% |
| v2 | Feb 2026 - Mar 2026 | MVRV Flat (long/flat) | +65% | 0.67 | -36% |
| v3 | Mar 2026+ | Adaptive Composite | +352% | 1.44 | -51% |
11.1 v1: Aggressive Leveraged Momentum (Oct 2023 - Feb 2026)
The initial strategy used a single momentum-based signal to determine position, with fixed leverage tiers and no on-chain data. Performance was strong during the 2023-2024 bull market (+182%) but the strategy carried a -63% maximum drawdown. The Sharpe ratio of 0.97 indicates the returns were achieved with high volatility. In the early 2025 bear market, the strategy held leveraged long positions into significant losses before momentum signals reversed.
11.2 v2: MVRV Flat (Feb 2026 - Mar 2026)
In response to the drawdown experienced in v1, the strategy was redesigned to incorporate the MVRV ratio as a flat trigger: when MVRV indicated overvaluation, the strategy exited to cash regardless of price momentum signals. This reduced the maximum drawdown to -36% and eliminated the most damaging drawdown periods, but the strategy's performance of +65% over the 2.5-year backtest was lower than v1's because MVRV alone as a filter caused premature exits during continued bull runs. The Sharpe ratio of 0.67 reflected the cost of over-filtering.
11.3 v3: Adaptive Composite (Mar 2026+)
The current strategy incorporates the insights from both predecessors. From v1, it retains the trend-following core: MA crossover, ROC momentum, and the 200 MA trend filter form 50% of the composite. From v2, it retains the on-chain intelligence: MVRV is now one of 8 signals rather than a binary override, allowing it to express concern without unilaterally closing positions. The addition of exchange flow, active addresses, NRPL, and social volume provides multi-dimensional on-chain context.
The walk-forward regime switch adds a layer of mechanical adaptation that neither v1 nor v2 possessed: the risk profile itself adjusts based on what has been working recently, without discretionary intervention.
The combined backtest result of +352% with a Sharpe of 1.44 and a -51% max drawdown represents the most favorable risk-adjusted profile of the three versions.
12. Limitations and Future Work
12.1 Known Limitations
Single asset: The strategy is designed exclusively for BTC/USD perpetuals. Signal weights, volatility thresholds, and on-chain metrics are all BTC-specific. Extension to other assets would require separate calibration.
No short positions: The strategy cannot generate returns during sustained bear markets. It mitigates losses by going flat, but forfeits the ability to profit from downside moves.
Santiment dependency: Five of eight signals depend on Santiment API availability and data quality. API outages or data gaps reduce signal completeness and can cause the system to fall back to price-only signals, altering the composite characteristics.
On-chain data lag: Santiment metrics are archived at 03:00 UTC and reflect data available at that time. Same-day on-chain events (exchange flows, address activity) are not reflected until the following day's archive.
Backtest period covers one full cycle: The 2.5-year test period includes one bull market and one correction. Additional full market cycles would provide stronger validation, particularly for the regime switch mechanism.
No funding rate modeling: The backtest models financing cost as a flat rate. Actual Hyperliquid perpetual funding rates vary and can differ significantly from the modeled 0.025%/day, particularly during high-open-interest bull market phases.
12.2 Potential Future Improvements
Short exposure: Developing a short-entry framework using the composite score's negative range (currently used only for flat exits) would allow the strategy to profit from sustained bear markets rather than simply reducing losses.
Dynamic signal weights: The current weights are fixed. A walk-forward optimization of weights (following the same anti-overfitting principles as the regime switch) could improve composite signal quality as market structure evolves.
Additional on-chain metrics: Santiment provides additional metrics not currently incorporated: age consumed (dormant coin movement), supply in profit/loss ratios, and miner flow data. These could enrich the composite signal.
Funding rate integration: Incorporating real-time funding rate data into the leverage decision would improve the live/backtest parity of financing cost modeling and could reduce leverage allocation when funding rates make leveraged longs expensive to hold.
Multi-asset regime context: BTC price action is influenced by macro conditions (equities, DXY, rates) not currently captured in the signal library. Incorporating cross-asset regime indicators could improve signal quality during macro-driven market phases.
MomentusXBT Whitepaper v2.0 | March 2026
Strategy: Adaptive Composite with Walk-Forward Regime Switch
Exchange: Hyperliquid DEX | Data: Hyperliquid (price), Santiment (on-chain)